Welcome to an exciting journey into the world of real-time data with HarperDB and Node.js! Imagine having an IoT dashboard that updates in real-time, giving instant insights into your data. Sounds intriguing, right? That's precisely what you'll build in this tutorial.
HarperDB is a powerful tool that combines a distributed database, cache, application, and streaming system into a single process. This unique combination allows for high performance and simplicity at scale, making it an excellent choice for real-time applications. In this project, you'll leverage HarperDB's capabilities to create a real-time IoT dashboard.
By the end of this tutorial, you'll have a fully functional dashboard that can visualize data from IoT devices in real-time.
You'll learn how to:
Set up and configure HarperDB
Simulate an IoT device sending data
Build a Node.js server to handle real-time data
Create a dynamic frontend to display data
Whether you're a seasoned developer or just getting started, this tutorial is designed to be hands-on and straightforward. Each step will guide you through the process, ensuring you understand how everything fits together. Ready to dive in and start building? Let's get started!
Project Setup
Start by setting up HarperDB and then create the necessary project structure. Follow these steps to get everything in place.
You can also download a copy of the project from GitHub!
- Installing and Configuring HarperDB
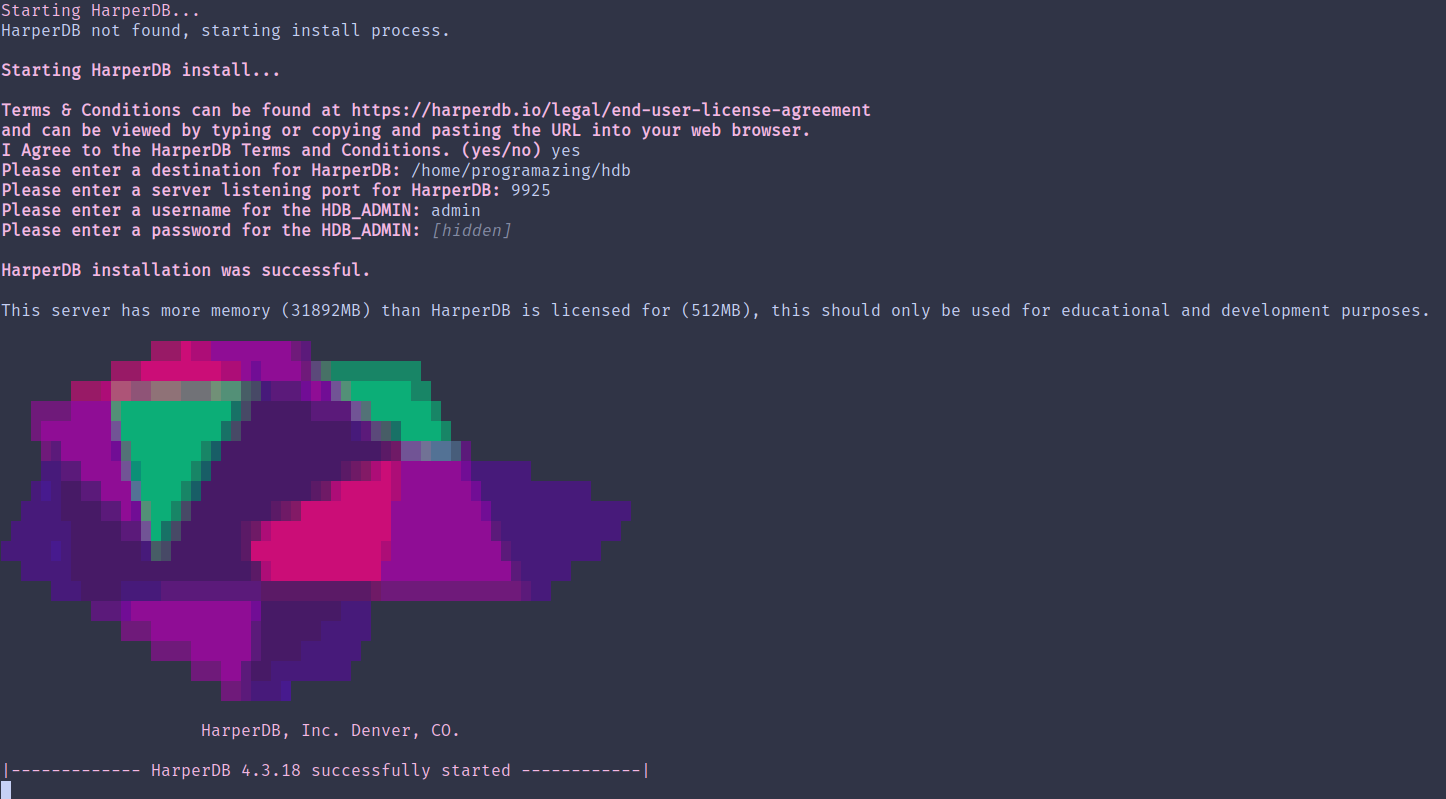
First, you'll need to install HarperDB. If you haven't already, head to the HarperDB website for the installation instructions tailored to your operating system. After installing HarperDB, you need to start the HarperDB server. Open your terminal and run the following command:
harperdb run
You should see a message indicating that HarperDB is up and running. By default, HarperDB runs on port 9925. You can access the HarperDB Studio at http://localhost:9925 to manage your database.

- Setting Up the Project Directory and Necessary Files
Now, set up the project directory. Open your terminal and navigate to your preferred workspace. Create a new directory for our project and navigate into it:
mkdir real-time-iot-dashboard
cd real-time-iot-dashboard
Next, initialize a new Node.js project:
npm init -y
This command creates a package.json file with the default settings. Now, install the required dependencies. You’ll need Express for our server, Axios for making HTTP requests, and WebSocket for real-time communication:
npm install express axios ws
With the dependencies installed, you'll need to create the necessary files and directories. Run the following commands:
mkdir public
touch server.js public/index.html
Here’s a quick overview of what each file will do:
server.js: This will be the main server file, handling HTTP and WebSocket connections.
public/index.html: This will be the frontend file, displaying the real-time data.
- Configuring HarperDB
Before moving on, you must set up a table in HarperDB to store the IoT data.
Create a file called schema.graphql in your project directory, then paste the following code:
type SensorData @table @export {
id: ID @primaryKey
timestamp: String
temperature: String
humidity: String
}
In a separate terminal window, run the following command to have HarperDB monitor the application directory:
harperdb dev .
You can learn more about creating tables in the Applications section.
Simulating an IoT Device
With the project setup complete, it's time to simulate an IoT device sending data to HarperDB. Create a Node.js script that generates random sensor data and sends it to the HarperDB instance. Follow these steps to get started.
- Creating the Node.js Script
First, create a new file in the project directory called simulate_device.js:
touch simulate_device.js
Open this file in your preferred code editor and start by requiring the necessary modules. Use Axios to send HTTP requests to HarperDB.
const axios = require('axios');
const { v4: uuidv4 } = require('uuid');
The uuid library will generate unique IDs for the sensor data. Install this library by running:
npm install uuid
- Generating Random Sensor Data
Next, create a function to generate random sensor data. Assume the IoT device measures temperature and humidity.
function generateSensorData() {
return {
id: uuidv4(),
timestamp: new Date().toISOString(),
temperature: (Math.random() * 40).toFixed(2), // Random temperature between 0 and 40
humidity: (Math.random() * 100).toFixed(2) // Random humidity between 0 and 100
};
}
- Sending Data to HarperDB
Now, create a function to send the generated sensor data to HarperDB using the REST API.
async function sendDataToHarperDB(data) {
const config = {
method: 'post',
url: 'http://localhost:9926/SensorData',
headers: {
'Content-Type': 'application/json'
},
data: JSON.stringify(data)
};
try {
const response = await axios(config);
console.log('Data sent successfully:', response.data);
} catch (error) {
console.error('Error sending data:', error);
}
}
- Automating Data Generation and Sending
Finally, create a loop to generate and send data at regular intervals. For instance, send data every 5 seconds.
setInterval(() => {
const data = generateSensorData();
sendDataToHarperDB(data);
}, 5000);
The complete simulate_device.js script should look like this:
const axios = require('axios');
const { v4: uuidv4 } = require('uuid');
function generateSensorData() {
return {
id: uuidv4(),
timestamp: new Date().toISOString(),
temperature: (Math.random() * 40).toFixed(2),
humidity: (Math.random() * 100).toFixed(2)
};
}
async function sendDataToHarperDB(data) {
const config = {
method: 'post',
url: 'http://localhost:9926/SensorData',
headers: {
'Content-Type': 'application/json'
},
data: JSON.stringify(data)
};
try {
const response = await axios(config);
console.log('Data sent successfully:', response.data);
} catch (error) {
console.error('Error sending data:', error);
}
}
setInterval(() => {
const data = generateSensorData();
sendDataToHarperDB(data);
}, 5000);
Run the script using the following command:
node simulate_device.js
The script will start generating random sensor data and sending it to HarperDB every 5 seconds. This setup simulates an IoT device and provides data for the real-time dashboard. In the next section, you'll build the real-time data ingestion setup, ensuring the IoT data flows smoothly into the dashboard.
Real-Time Data Ingestion
Now that your IoT device simulation sends data to HarperDB, it's time to set up real-time data ingestion. This setup will allow the frontend to receive and display data as soon as it's available. Follow these steps to create a seamless flow of data from HarperDB to the dashboard.
- Setting Up the Node.js Server
First, you'll create a Node.js server to handle real-time data communication. This server will use WebSocket to push updates to the frontend.
Open the server.js file and start by requiring the necessary modules:
const express = require('express');
const http = require('http');
const WebSocket = require('ws');
const axios = require('axios');
Next, set up the basic Express server and HTTP server:
const app = express();
const server = http.createServer(app);
const wss = new WebSocket.Server({ server });
// Serve static files from the 'public' directory
app.use(express.static('public'));
// Serve index.html at the root endpoint
app.get('/', (req, res) => {
res.sendFile(__dirname + '/public/index.html');
});
// Start the server on port 3000
server.listen(3000, () => {
console.log('Server is running on http://localhost:3000');
});
- Handling WebSocket Connections
Set up the WebSocket server to handle connections and send real-time data to connected clients:
wss.on('connection', (ws) => {
console.log('Client connected');
ws.on('close', () => {
console.log('Client disconnected');
});
});
- Fetching Data from HarperDB
To fetch data from HarperDB, create a function that retrieves the latest sensor data. Use this function to periodically check HarperDB for new data and send updates to the frontend:
async function fetchDataAndUpdateClients() {
const config = {
method: 'post',
url: 'http://localhost:9925', // HarperDB endpoint
headers: {
'Content-Type': 'application/json'
},
data: JSON.stringify({
operation: 'sql',
sql: 'SELECT * FROM data.SensorData ORDER BY timestamp DESC LIMIT 1'
})
};
try {
const response = await axios(config);
const latestData = response.data;
// Check if the response data is an array (expected format)
if (Array.isArray(latestData)) {
// Broadcast latest data to all connected clients
wss.clients.forEach((client) => {
if (client.readyState === WebSocket.OPEN) {
client.send(JSON.stringify(latestData));
}
});
} else {
console.error('Unexpected data format:', latestData);
}
} catch (error) {
console.error('Error fetching data:', error);
}
}
// Periodically fetch data and update clients every 5 seconds
setInterval(fetchDataAndUpdateClients, 5000);
This function queries HarperDB for the latest sensor data and sends it to all connected WebSocket clients every 5 seconds.
If you go to http://localhost:9925/SensorData you should see something like this:

- Setting Up the Frontend to Receive Data
Finally, configure the frontend to connect to the WebSocket server and display the received data. Open the public/index.html file and add the following code:
<!DOCTYPE html>
<html lang="en">
<head>
<meta charset="UTF-8">
<meta name="viewport" content="width=device-width, initial-scale=1.0">
<title>Real-Time IoT Dashboard</title>
</head>
<body>
<h1>Real-Time IoT Dashboard</h1>
<div id="dataContainer">
<p>Waiting for data...</p>
</div>
<script>
const dataContainer = document.getElementById('dataContainer');
const ws = new WebSocket('ws://localhost:3000');
ws.onmessage = (event) => {
const data = JSON.parse(event.data);
if (Array.isArray(data)) {
dataContainer.innerHTML = ''; // Clear previous data
data.forEach(sensorData => {
const { id, timestamp, temperature, humidity } = sensorData;
const dataDiv = document.createElement('div');
dataDiv.classList.add('data-item');
dataDiv.innerHTML = `
<p>ID: ${id}</p>
<p>Timestamp: ${timestamp}</p>
<p>Temperature: ${temperature} °C</p>
<p>Humidity: ${humidity} %</p>
<hr>
`;
dataContainer.appendChild(dataDiv);
});
} else {
console.error('Received unexpected data format:', data);
// Handle single data object case, if needed
const { id } = data;
const dataDiv = document.createElement('div');
dataDiv.classList.add('data-item');
dataDiv.innerHTML = `
<p>ID: ${id}</p>
<p>Unexpected data format, check console for details.</p>
`;
dataContainer.appendChild(dataDiv);
}
};
ws.onopen = () => {
console.log('WebSocket connection established.');
};
ws.onclose = () => {
console.log('WebSocket connection closed.');
};
</script>
</body>
</html>
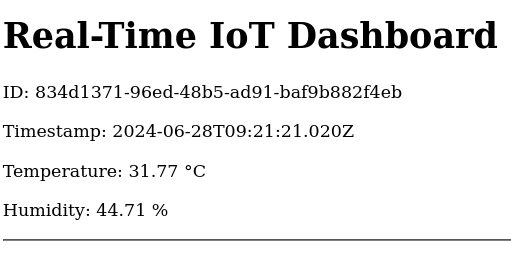
This code establishes a WebSocket connection to the server and updates the page with the latest sensor data.
At this point the application should look like this:
Building the Dashboard
Now that you've set up real-time data ingestion, it's time to build a polished and interactive dashboard to visualize the IoT data. Follow these steps to enhance the user interface and create dynamic charts.
- Setting Up Chart.js
To create beautiful charts, use Chart.js. First, add the Chart.js library to your project. Include the following script tag in the section of your public/index.html file:
<head>
<script src="https://cdn.jsdelivr.net/npm/chart.js"></script>
<script src="https://cdn.jsdelivr.net/npm/chartjs-adapter-date-fns@3.0.0"></script>
</head>
- Creating the HTML Structure
Modify the HTML structure to include a canvas element for the chart. Update the public/index.html file:
<!DOCTYPE html>
<html lang="en">
<head>
<meta charset="UTF-8">
<meta name="viewport" content="width=device-width, initial-scale=1.0">
<title>Real-Time IoT Dashboard</title>
<script src="https://cdn.jsdelivr.net/npm/chart.js"></script>
<script src="https://cdn.jsdelivr.net/npm/chartjs-adapter-date-fns@3.0.0"></script>
<link rel="stylesheet" href="styles.css">
<script>
console.log("Chart.js loaded:", Chart); // Check if Chart.js is loaded
</script>
</head>
<body>
<h1>Real-Time IoT Dashboard</h1>
<div id="dataContainer">
<p>Waiting for data...</p>
</div>
<canvas id="myChart" width="400" height="200"></canvas>
<script>
const dataContainer = document.getElementById('dataContainer');
const ctx = document.getElementById('myChart').getContext('2d');
const ws = new WebSocket('ws://localhost:3000');
let chart;
ws.onmessage = (event) => {
const data = JSON.parse(event.data);
if (Array.isArray(data)) {
dataContainer.innerHTML = ''; // Clear previous data
data.forEach(sensorData => {
const { id, timestamp, temperature, humidity } = sensorData;
const dataDiv = document.createElement('div');
dataDiv.classList.add('data-item');
dataDiv.innerHTML = `
<p>ID: ${id}</p>
<p>Timestamp: ${timestamp}</p>
<p>Temperature: ${temperature} °C</p>
<p>Humidity: ${humidity} %</p>
<hr>
`;
dataContainer.appendChild(dataDiv);
updateChart(sensorData);
});
} else {
console.error('Received unexpected data format:', data);
// Handle single data object case, if needed
const { id } = data;
const dataDiv = document.createElement('div');
dataDiv.classList.add('data-item');
dataDiv.innerHTML = `
<p>ID: ${id}</p>
<p>Unexpected data format, check console for details.</p>
`;
dataContainer.appendChild(dataDiv);
}
};
ws.onopen = () => {
console.log('WebSocket connection established.');
};
ws.onclose = () => {
console.log('WebSocket connection closed.');
};
function createChart(data) {
chart = new Chart(ctx, {
type: 'line',
data: {
labels: [data.timestamp],
datasets: [
{
label: 'Temperature (°C)',
data: [data.temperature],
borderColor: 'rgba(255, 99, 132, 1)',
borderWidth: 1,
fill: false
},
{
label: 'Humidity (%)',
data: [data.humidity],
borderColor: 'rgba(54, 162, 235, 1)',
borderWidth: 1,
fill: false
}
]
},
options: {
scales: {
x: {
type: 'time',
time: {
unit: 'minute'
}
},
y: {
beginAtZero: true
}
}
}
});
}
function updateChart(data) {
if (chart) {
chart.destroy(); // Destroy the existing chart instance
}
createChart(data);
}
</script>
</body>
</html>
- Initializing the Chart
The createChart function initializes the chart with the first data point received. It sets up two datasets, one for temperature and one for humidity. The updateChart function updates the chart with new data points as they arrive.
- Updating the Chart
Each time new data is received through the WebSocket, the updateChart function adds the latest data to the chart and updates the display.
- Styling the Dashboard
Add some basic CSS to improve the dashboard's appearance. Create a public/styles.css file and include it in the HTML file:
body {
font-family: Arial, sans-serif;
display: flex;
flex-direction: column;
align-items: center;
justify-content: center;
height: 100vh;
margin: 0;
}
h1 {
margin-bottom: 20px;
}
#data {
margin-bottom: 20px;
text-align: center;
}
canvas {
max-width: 100%;
height: auto;
}
Ensure your dashboard is optimized for mobile devices by implementing responsive design principles. Adjust layout and styling to provide a seamless user experience across different screen sizes.
/* Example CSS for responsive design */
@media (max-width: 768px) {
body {
font-size: 14px;
}
/* Adjust other styles as needed */
}
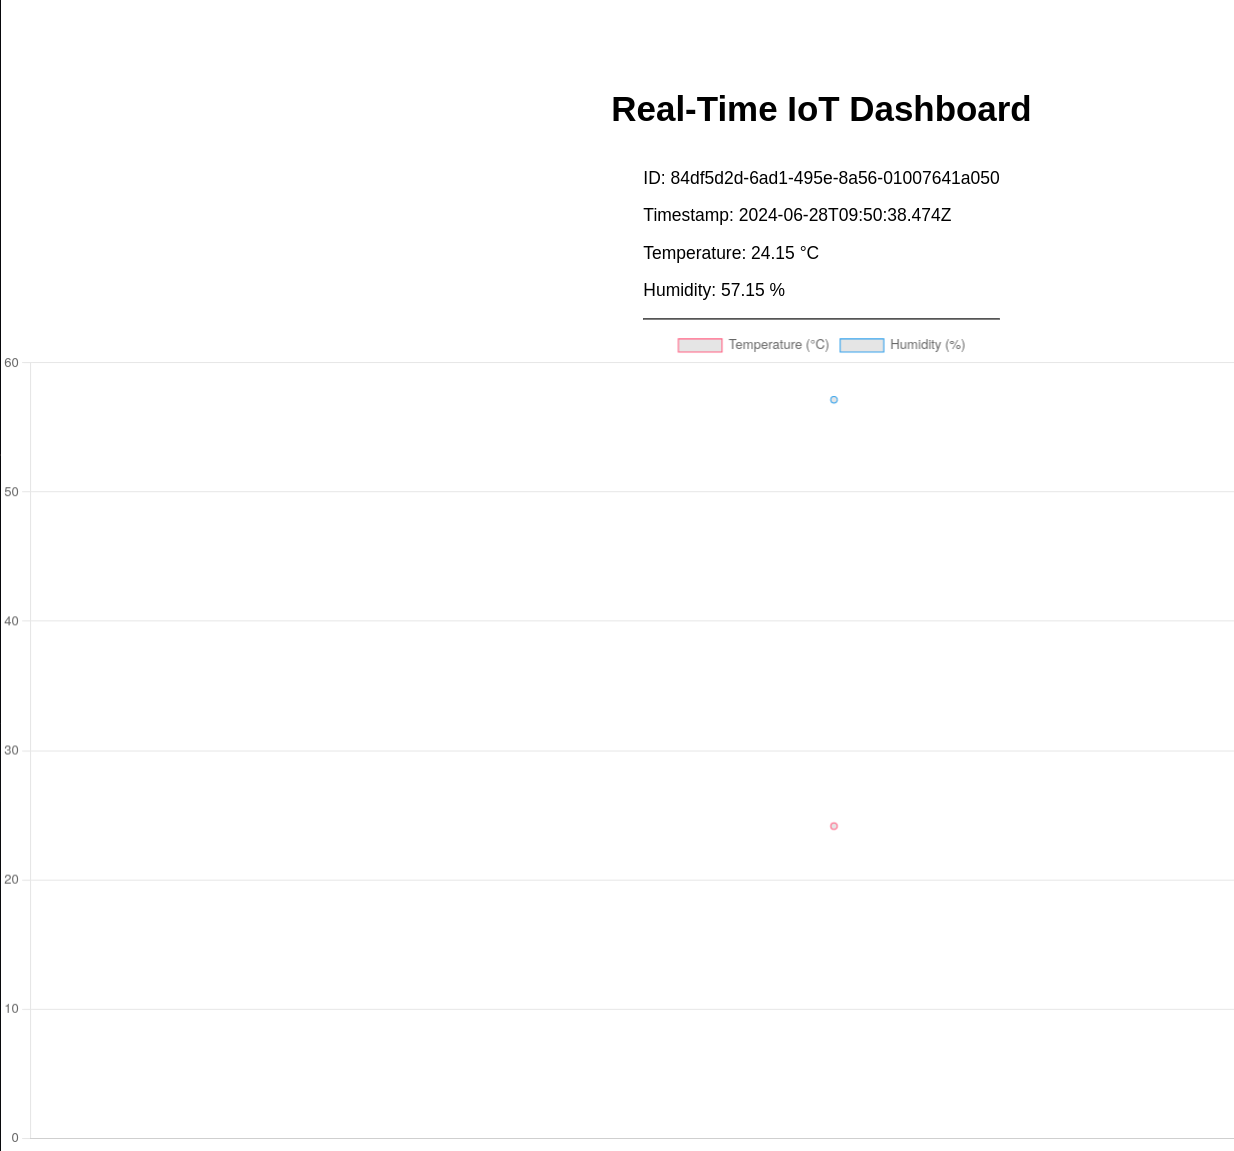
Look at this thing of beauty!

Your interactive dashboard is now complete! It receives real-time data from the simulated IoT device and visualizes it using Chart.js. The dynamic chart updates automatically as new data arrives, providing a clear and engaging way to monitor sensor readings.
Consider adding data analysis and insights features, such as trend analysis, statistical summaries, or predictive analytics based on historical data trends. These enhancements can provide valuable insights for users.
By enhancing data visualization on the frontend, you're creating a more engaging and informative IoT dashboard. Experiment with these customization options to tailor the dashboard to your project's requirements and improve user interaction with real-time sensor data.
Wrapping it up!
Congratulations on building your own real-time IoT dashboard using HarperDB and Chart.js! This tutorial covered essential steps to set up a robust data pipeline, visualize sensor data dynamically, and enhance user interaction with real-time alerts and responsive design.
By customizing Chart.js configurations and integrating additional widgets, you've learned how to tailor data visualization to specific project needs. Implementing real-time alerts and notifications ensures timely updates on critical sensor readings, enhancing the dashboard's utility. Remember, optimizing for mobile and responsive design ensures a seamless user experience across devices, making your dashboard accessible anytime, anywhere. Exploring further enhancements like data analysis and insights can provide deeper insights into sensor trends and performance metrics.
As you refine and expand your IoT dashboard, don't hesitate to experiment with different visualizations and features. Embrace a hands-on approach, iterate based on user feedback, and stay curious about new technologies and possibilities.
Keep building, learning, and pushing the boundaries of what's possible with IoT and data visualization. Share your creations with the developer community and showcase your skills in crafting meaningful and impactful technical solutions.
Happy coding!
Here are some other resources you might enjoy!
How to Build a Real-Time Crypto Dashboard with HarperDB
In this tutorial, Michael King demonstrates creating a straightforward dynamic dashboard to display cryptocurrency prices and news articles using HarperDB. The article covers setting up the database, using Angular for the frontend, and integrating RSS feed parsing.
Real-Time Communication with HarperDB
Learn about using WebSocket servers and HarperDB's leaf stream for real-time communication. This article explores setting up custom functions and creating a real-time chat application.
Build a Dynamic REST API with Custom Functions
Terra Roush's tutorial guides you through building a REST API with custom functions in HarperDB. It covers creating endpoints, handling requests, and integrating with your application.
